
Satellite intelligence for gas flaring oversight
AI-powered monitoring of unusual year-on-year changes in gas flaring worldwide.
billion cubic meters flared globally in 2025
CO₂-equivalent produced
Estimated value of gas flared in 2025
Source: World Bank GFMR, Global Gas Flaring Tracker, June 2026
A problem hiding in plain sight
Gas flaring, the burning of associated gas at oil wellheads when there is no pipeline or market for it, wasted gas worth an estimated US$54 billion in 2025 and produced about 429 million tonnes of CO₂-equivalent. Regulators are tightening. Lenders are beginning to attach flaring reduction targets to oil and gas financing. Independent, satellite-verified monitoring is becoming a compliance requirement, not an optional extra.
Sigma FlareWatch makes that monitoring accessible.
From satellite to insight in four steps
Satellite data
NOAA's VIIRS Nightfire catalog records every gas flare detected globally, going back to 2012. Free and publicly available.
Clean and aggregate
Annual flare volumes are aggregated by country and region, producing a consistent time series for each entity.
Score anomalies
A statistical model flags year-over-year deviations that exceed normal variation for each entity's own historical pattern, or that move by 1 bcm or more in a single year.
Surface insights
Scores are published to a live interactive map and exportable PDF reports.
Built for the people who need to know
Country-level trend tracking
Year-over-year flaring trends for every country in the VIIRS catalog, going back to 2012.
Regional drill-down
Permian Basin available as a dedicated view with time-series charts.
Anomaly scoring
A row is flagged when its z-score exceeds ±1.5 against the entity's own history, or when its year-on-year change is 1 bcm or more.
Live interactive map
Color-coded severity overlay on a global map. Click any country or region to drill into the trend.
Automated PDF reports
Client-ready, branded PDF reports for any country or region, generated on demand.
Verified data source
Built on VIIRS Nightfire, the same satellite catalog the World Bank uses for its own annual global flaring tracker.
A live view of global flaring
LiveCountries tracked, plus the Permian Basin region
104
Flagged for review
11
Data range
2012–2025
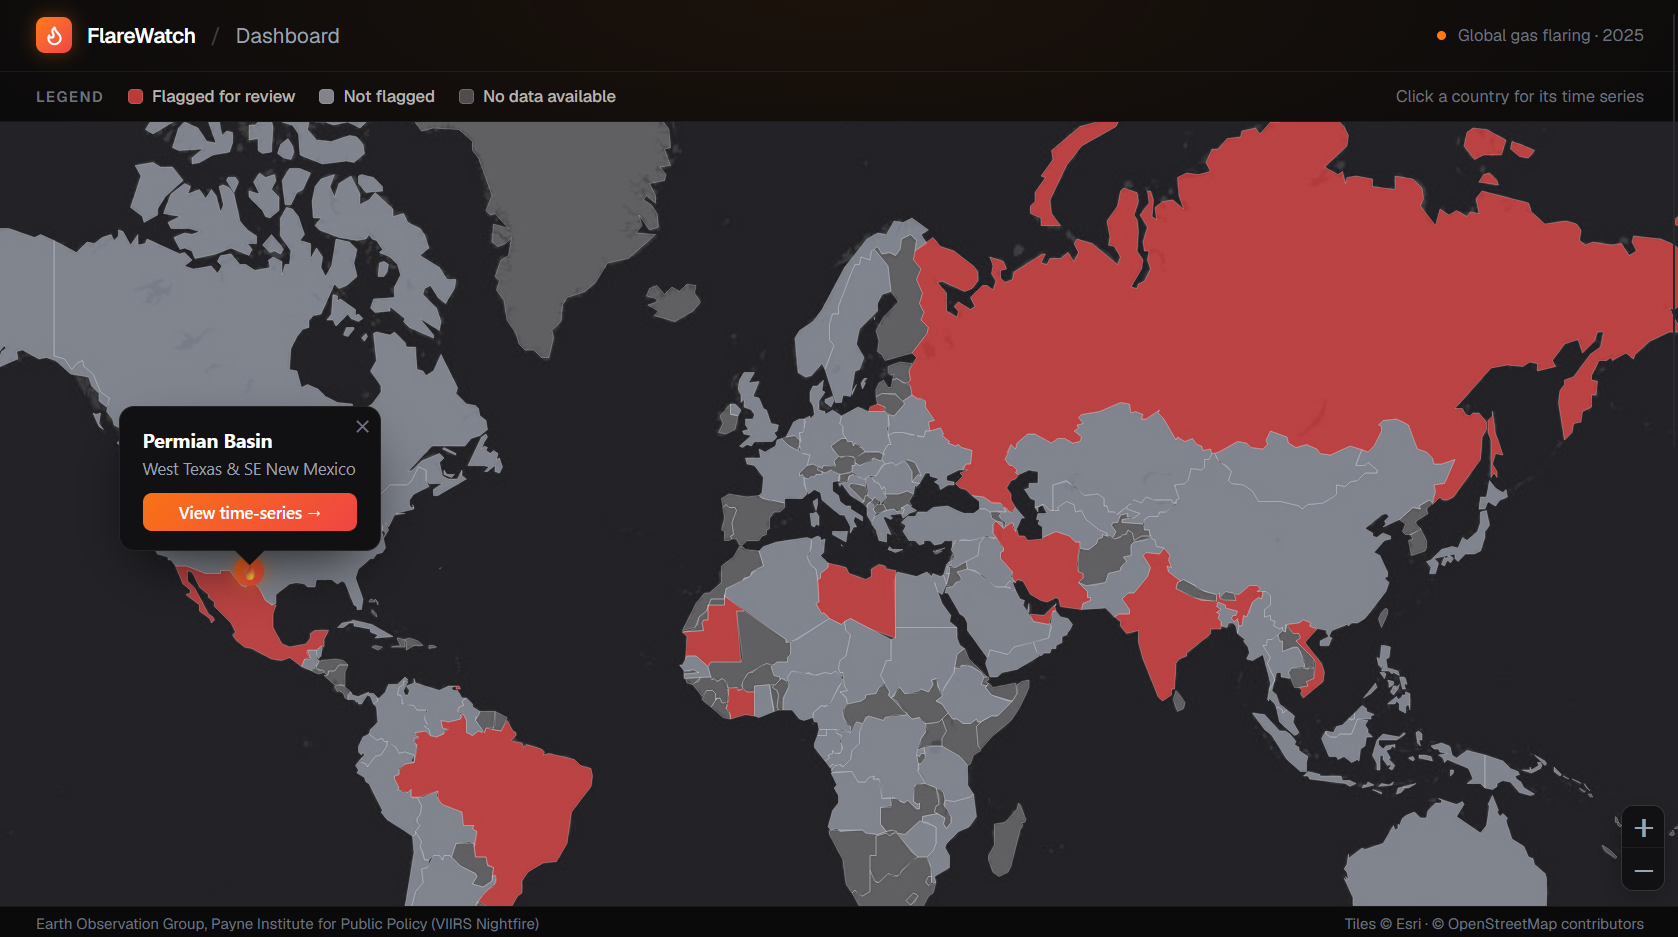
Main dashboard: global map, flagged countries in red
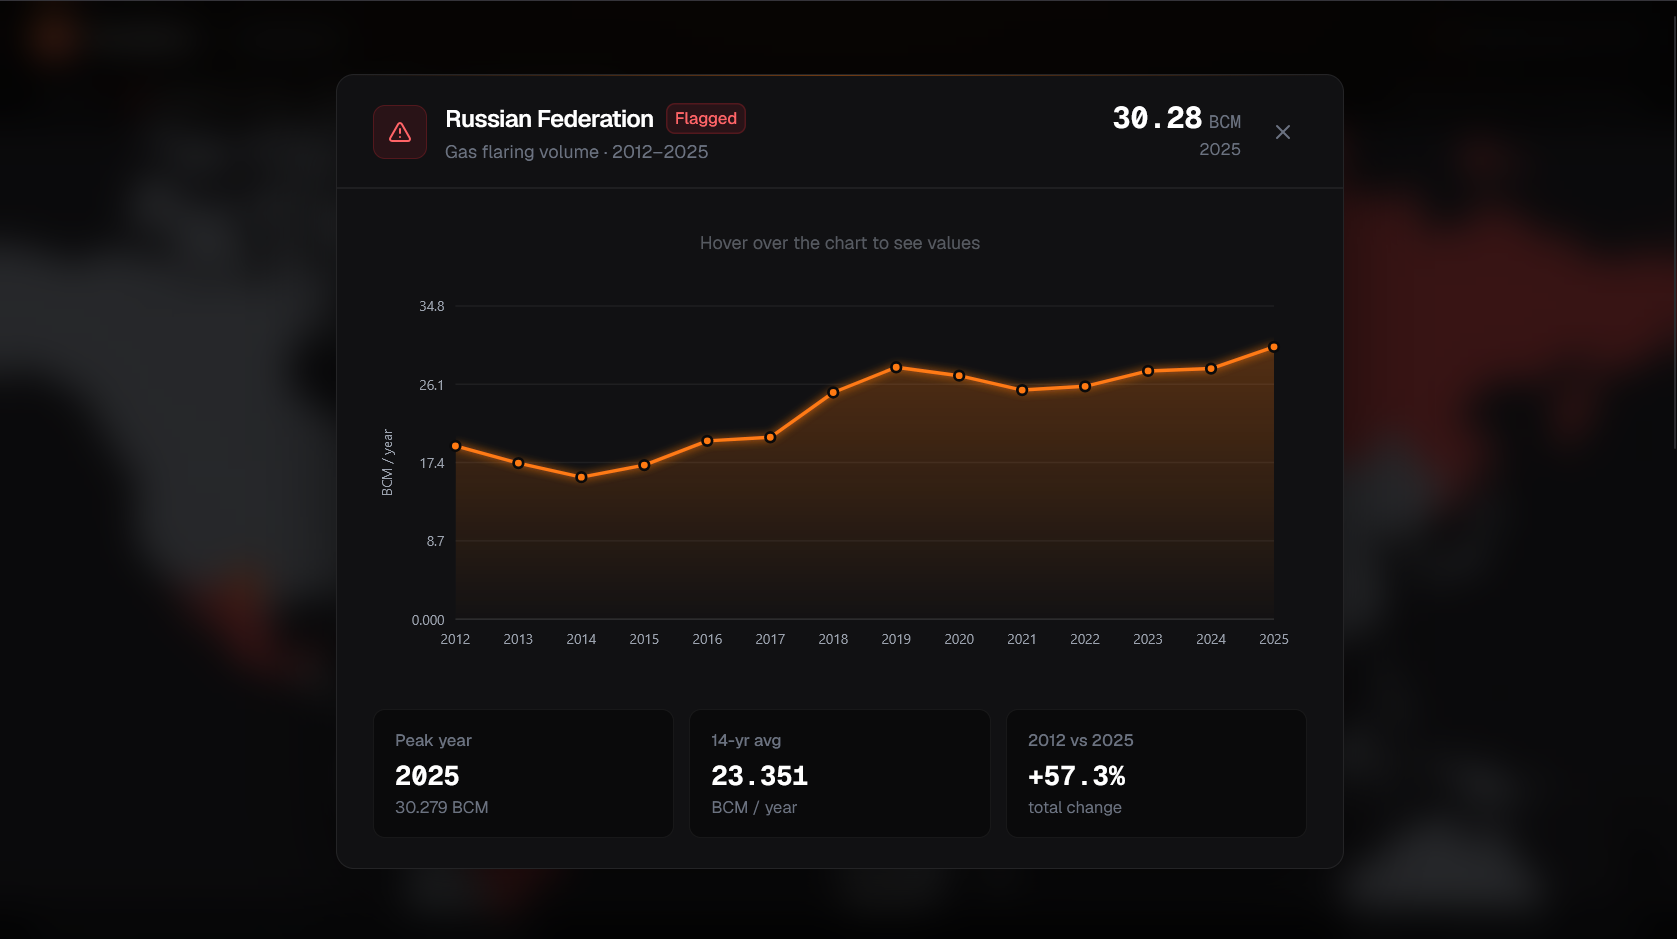
Country trend chart: Russia (flagged for review)
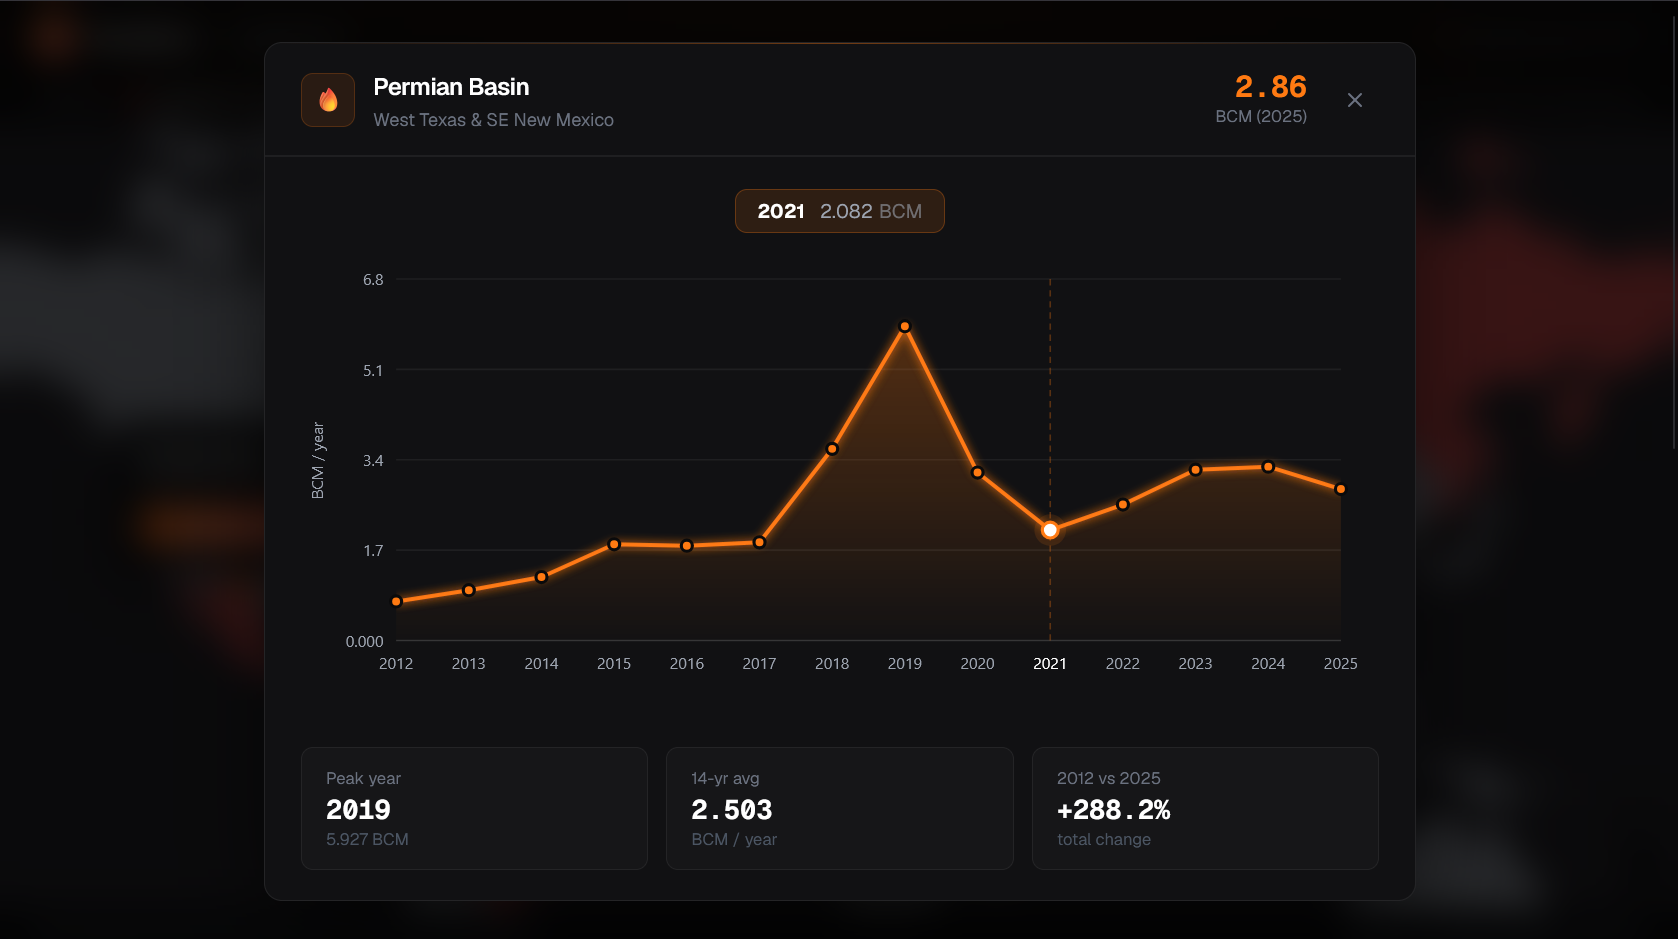
Regional drill-down: Permian Basin
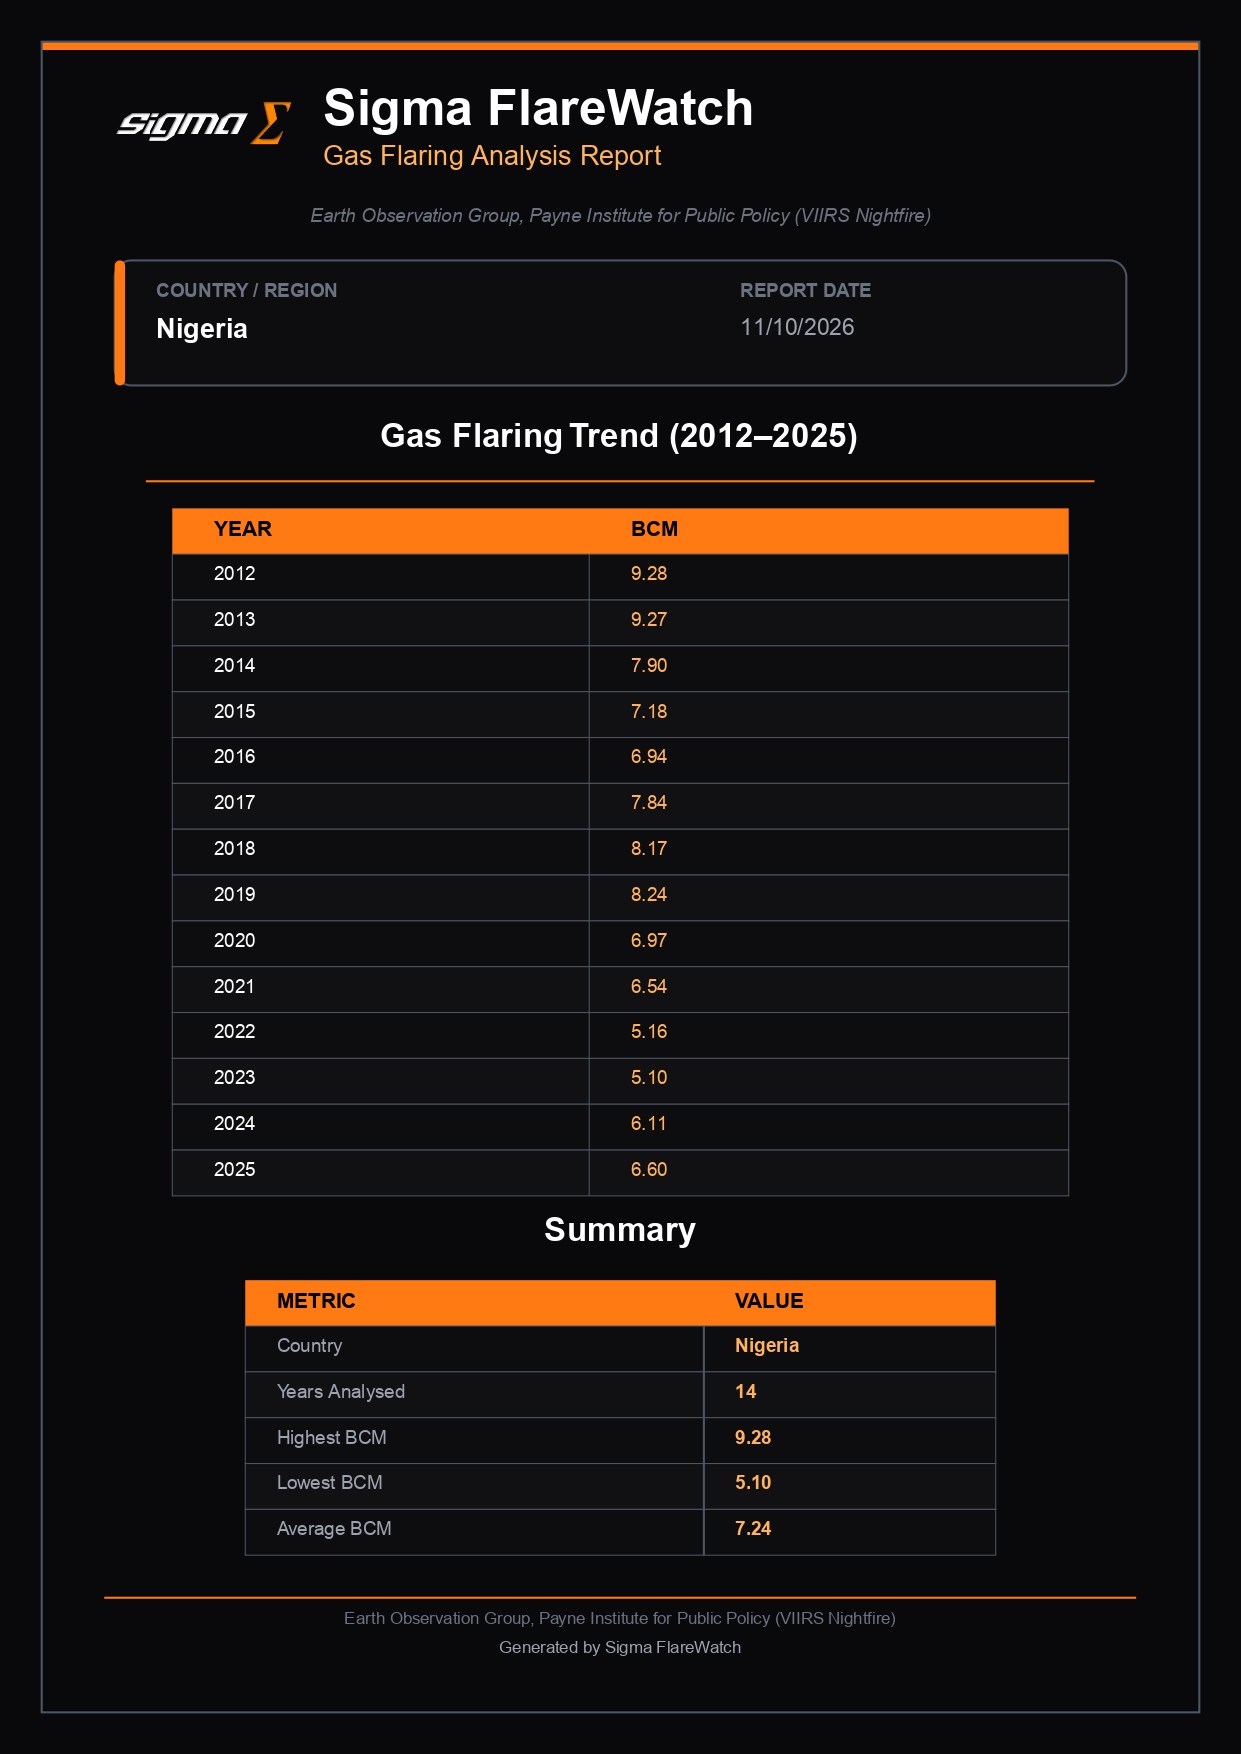
PDF report export: Nigeria
Interactive map, flagged countries, country and regional drill-downs, and PDF reports. Click any image to expand.
Data: World Bank Global Gas Flaring Tracker (June 2026) and Earth Observation Group, Payne Institute for Public Policy (VIIRS Nightfire)
Built on the same source as the World Bank
Sigma FlareWatch uses the VIIRS Nightfire annual global flare catalog, published by NOAA's Earth Observation Group at the Payne Institute, Colorado School of Mines. This is the primary global flaring dataset used by the World Bank's Global Flaring and Methane Reduction Partnership for its own annual reporting.
Country volumes for 2012–2025 come from the World Bank's Global Gas Flaring Tracker (June 2026 edition), produced with the Earth Observation Group using the new three-satellite methodology. The Permian Basin series is FlareWatch's own aggregation of site-level flare data for an approximate basin boundary.
The data covers 2012 through 2025. It is free, publicly available, and carries no commercial data access fees. This keeps FlareWatch accessible at a price point that enterprise satellite data providers cannot match.
Data: World Bank Global Gas Flaring Tracker (June 2026) and Earth Observation Group, Payne Institute for Public Policy (VIIRS Nightfire). eogdata.mines.edu
Three audiences, one platform
ESG and sustainability teams
Access independent, satellite-verified flaring data for portfolio monitoring, reporting, and regulatory response, without enterprise pricing.
Operators
Demonstrate flaring reduction progress to lenders, regulators, and stakeholders with a credible third-party data source.
Lenders and analysts
Verify flaring commitments in your portfolio independently. Satellite data, not self-reported figures.
Live today
Problem validated, data access confirmed
Architecture and data pipeline finalized
Dashboard, anomaly scoring, and PDF reports
Public beta launch
In progress
Operator and ESG team pilot program
Expanded regional drill-downs and custom alerting
API access for enterprise integrations
Sigma FlareWatch was built by the SigmaE Global Summer 2026 internship cohort. The platform is publicly available now.
Interested in a pilot?
We are working with a small number of operators, ESG teams, and lenders on pilot deployments. If you want to put satellite-verified flaring data to work in your organization, reach out directly.
Get in touchOr email us at info@sigmae.global